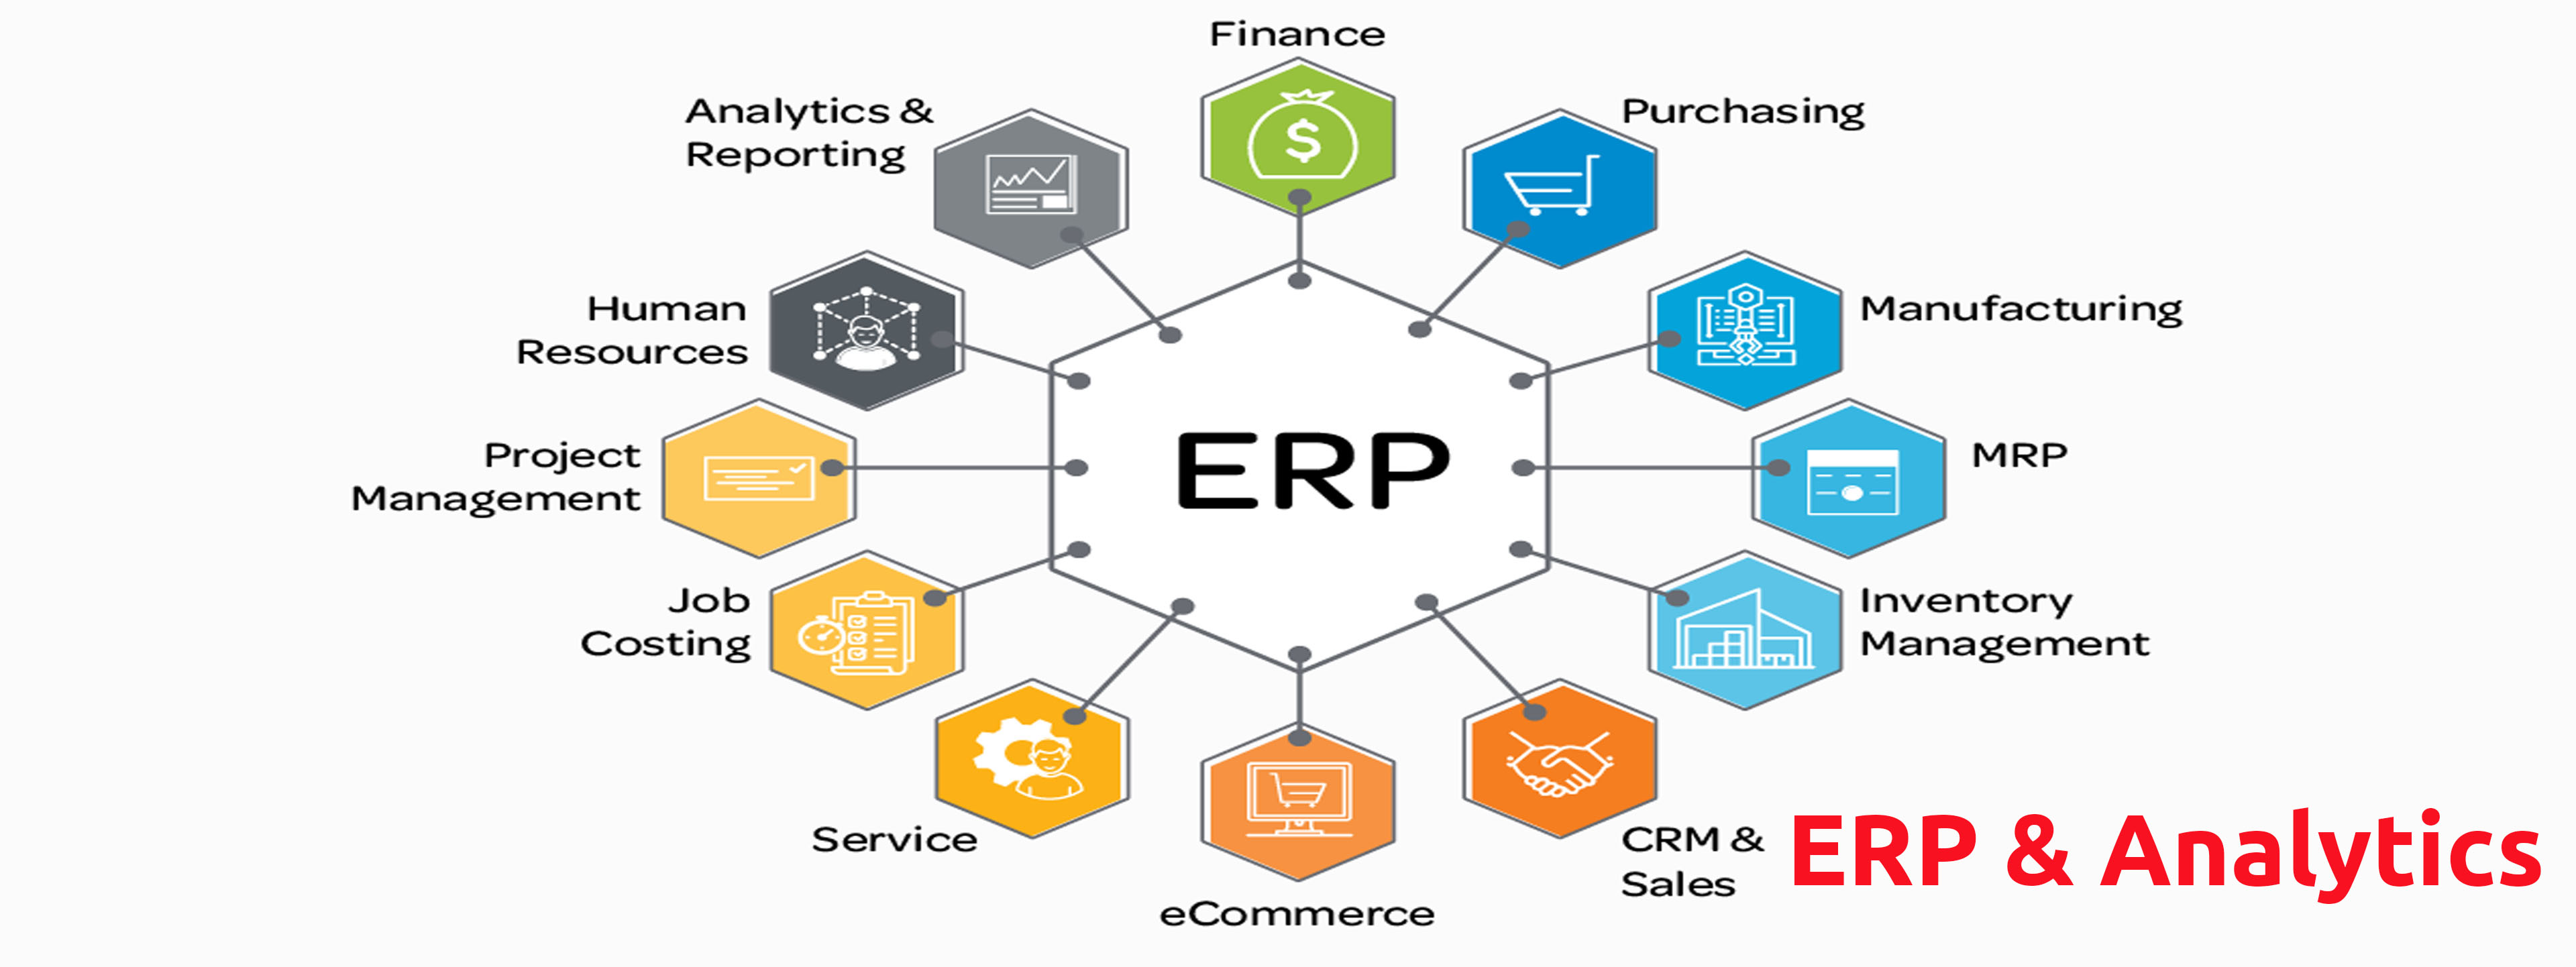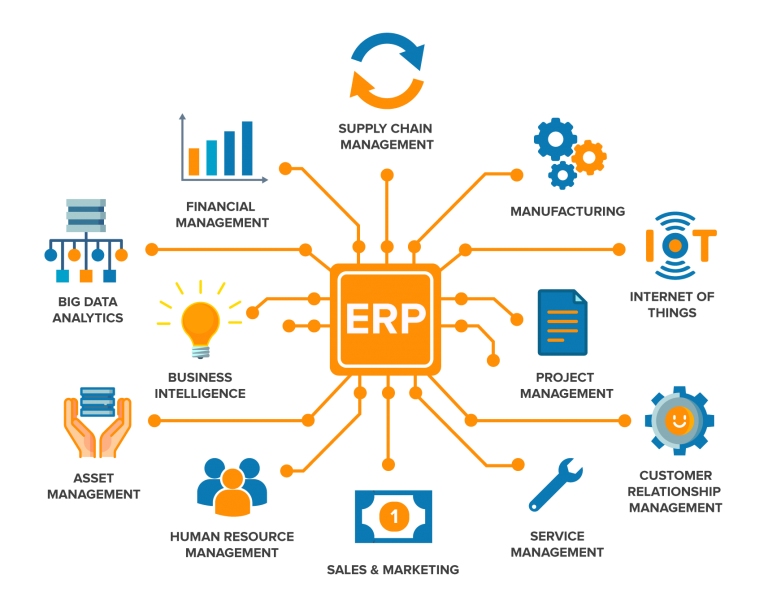

Enterprise Resource Planning or more commonly known as ERP and predictive analytics go hand-in-hand in terms of bringing the best out of your business. And there is no doubt that, nowadays, ERP analytics is an essential part of every business process. And over the past few years, the analysis of big analytical data as well as bringing the flexibility into the enterprise’s critical operation has only benefitted organizations for progressing towards the larger business prospect.
Advanced analytics describes data analysis that goes beyond simple mathematical calculations such as sums and averages, or filtering and sorting. Advanced analyses use mathematical and statistical formulas and algorithms to generate new information, to recognize patterns, and also to predict outcomes and their respective probabilities.
Predictive analytics is a sub-division of advanced analytics and focuses on the identification of future events and values with their respective probabilities. Advanced and predictive analytics can be applied to a variety of use cases, ranging from classic customer value and success forecasts, the prevention of contract termination or price, sales and demand forecasts to new tasks such as the prediction of machine failures, social media monitoring and evaluation, and predictive policing.
Staying on top of customer churn is an essential requirement of a healthy and successful business. Particularly, most companies with a subscription based business model regularly monitor churn rate of their customer base. In addition, cost of acquiring new customers is typically high. This makes predictive models of customer churn appealing as they enable companies to maintain their existing customers at a higher rate.
Project management software has made it easy to track project and portfolio performance. Nearly every tool comes with pre-built and customizable dashboards and reports, putting a wealth of information into the hands of business leaders.
Top Project Management KPIs That Can Benefit your Small Businesses Code Maven Limited provides :
1. Return on Investment (ROI)
2. Cost Performance Index (CPI)
3. Schedule Performance Index (SPI)
4. Resource Capacity
Code Maven Limited provides RFM analysis for your business that is a customer segmentation technique that uses past purchase behavior to divide customers into groups. RECENCY (R): Time since last purchase. FREQUENCY (F): Total number of purchases. MONETARY VALUE (M): Total monetary value
Specially for pharmaceutical businesses, Code Maven Limited gives you the advantage of having an already built solution with the market analysis key metrics and dashboards that allows you to measure company, product, territories performance in a client defined market and run insight reports all on an online platform.
By analyzing the time series we have evaluated transactional market data that helps your business to grow using the predictive model & block chain technology.
We provide Global World data report that includes General, Demographics, Race, Gender and a Combined report. The reports contain over 50 key demographic statistics including household income, population, median age and business employment.
Code Maven Limited provides report clustering based on features. Clustering is used in market segmentation; where we try to fined customers that are similar to each other whether in terms of behaviors or attributes, image segmentation/compression; where we try to group similar regions together, document clustering based on topics, etc.

+88 01721562396